

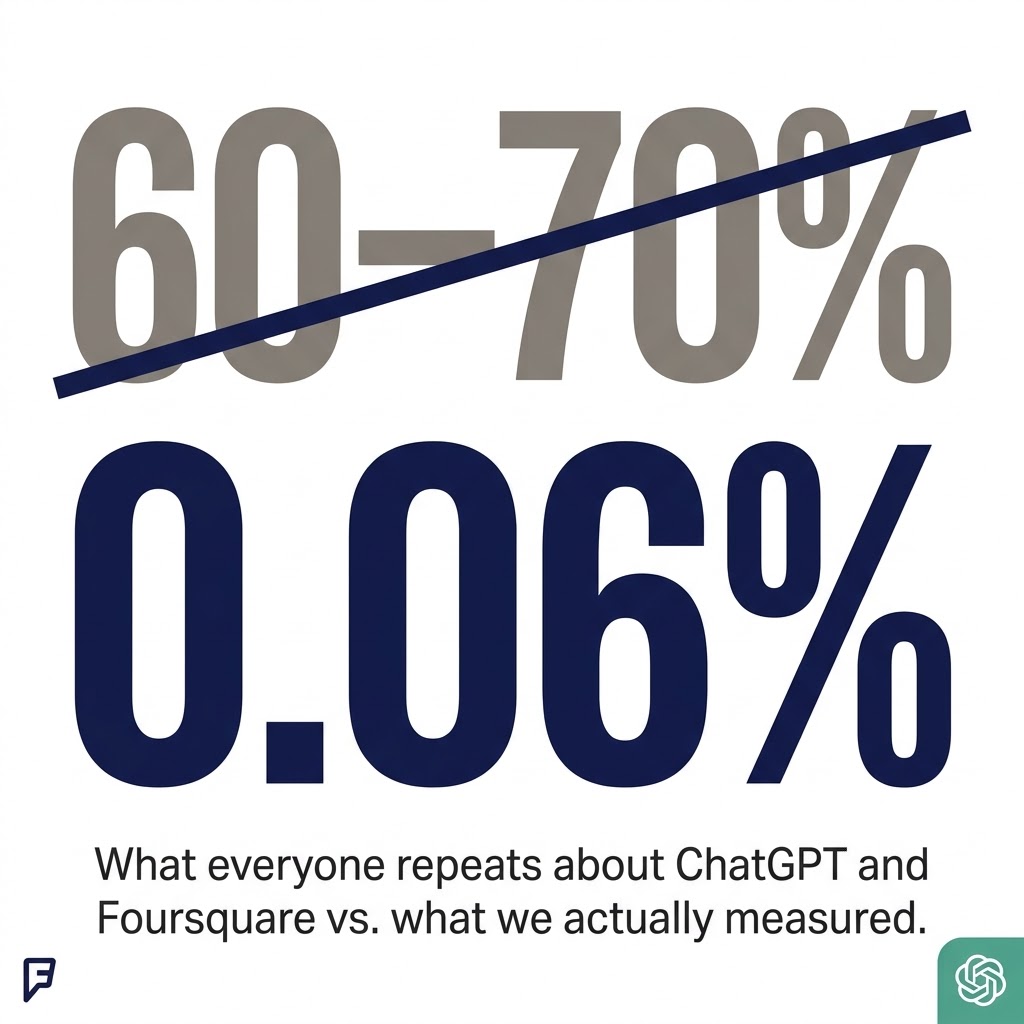
ChatGPT’s local results are not coming from Foursquare
And they may never have been—not in the broad way the industry claim suggests
For more than a year, local SEO articles and posts have repeated the same number: 60–70% of ChatGPT’s local results come from Foursquare city-guide listings.
I traced that number to its source, then tested it with 2,880 prompts designed to give Foursquare every reasonable advantage.
The original research was real. The claim that circulated afterward was much broader than the research supported.
2,880 prompts · 4,607 successful runs across two surfaces · 12 metros · 12 verticals · August 2026
What is not in dispute
OpenAI and Foursquare have a real partnership. Foursquare says its Places data contains more than 100 million points of interest and powers ChatGPT search. Nothing in this study disputes that.
This study tests a narrower claim: that 60–70% of ChatGPT’s local results come from Foursquare city-guide listings.
The short version
| Result | Finding |
|---|---|
| 0.00% | Foursquare citation share on ChatGPT’s primary surface |
| 0.06% | Foursquare citation share on the independent cross-check—one citation in 1,728 runs |
| 95.83% | Runs with Yelp attached to structured business cards |
| 7.5% vs. 5.7% | Mean overlap between ChatGPT’s named businesses and Google versus Foursquare |
| 87.5% | Seven of eight downstream repetitions dropped every caveat |
| 60–70% | The original finding: Spain, May 2025, first-ranked result only |
Four findings
- Foursquare’s observed citation share was effectively zero. It was 0.00% on the primary surface and 0.06% on the independent cross-check.
- Yelp occupied the structured-card slot described in the old Foursquare claim. Yelp appeared in 95.83% of runs.
- The hidden-influence explanation did not receive support from the resemblance test. ChatGPT’s named businesses overlapped more with Google’s ranked set than Foursquare’s.
- The original result lost its scope as it circulated. Five Spanish cities, first result only, and May 2025 disappeared from later retellings.
Where the 60–70% number came from
The earliest source I found was a real study published May 5, 2025 by Spanish SEO consultant Natzir Turrado.
It used 50 prompts across five Spanish cities and inspected ChatGPT’s raw JSON responses. The finding was that 60–70% of the businesses ChatGPT placed first came from Foursquare.
That scope matters:
- Five cities, all in Spain
- One country
- The first-ranked result—not local results generally
- Data collected in May 2025
The original article stated the finding broadly despite its Spain-only sample. As other writers repeated it, the remaining qualifiers disappeared.
A companion post by another researcher on the same day used three queries. It did not report a percentage, although later articles credited it with one.
How the claim travelled
| Date | Node | Number | What happened |
|---|---|---|---|
| May 5, 2025 | Original study | 60–70% | 50 prompts, five Spanish cities, first-ranked result, raw JSON |
| May 5, 2025 | Companion post | None | Three queries; no percentage reported |
| May 14, 2025 | Digital-agency blog | 60–70% | Combined both posts into an unqualified claim about local results |
| July 7, 2025 | LinkedIn Pulse post | 70%+ | Attributed to unnamed analysis of “millions” of citations; no methodology |
| July 22, 2025 | BrightLocal | 60–70% | Linked both sources and used the hedge “Reports suggest” |
| October 7, 2025 | Secondary blog | 70%+ | Sources removed; claim rounded upward |
| April 4, 2026 | Consultancy blog | About 70% | Presented repeatedly without a source |
| April 23, 2026 | Unbylined blog | 60% | Presented as a discovery from client work |
| May 16, 2026 | Vendor guide | About 70% | Added an unsupported comparison with Google and Yelp |
| June 18, 2026 | Agency blog | 60–70% | Traced the Spanish source but still used the scoped result as a broad headline claim |
Of the eight repetitions downstream from the original pair, seven carried no hedge. BrightLocal was the only one that both linked the sources and signalled uncertainty.
That makes the caveat-loss rate 87.5%, but the denominator is only eight. The trace covers the ten nodes found through systematic search, not every repetition on the web.
The sample was designed to favor Foursquare
A sample made entirely of plumbers and dentists would not be a fair test of a city-guide dataset.
Seven of the 12 verticals were chosen from Foursquare’s natural territory: restaurants, bars and nightlife, coffee shops, hotels, museums and attractions, live-music venues, and bakeries. The markets included dense urban cores such as New York, San Francisco, Chicago, and Los Angeles.
Plumbers and auto repair remained as unfavorable controls so we could see whether a category gradient appeared.
Finding 1: Foursquare’s citation share was effectively zero
“Citation share” means that a Foursquare-controlled domain appeared as a source ChatGPT linked to or retrieved. It does not measure whether Foursquare data influenced the answer invisibly. The resemblance test later in the article addresses that question indirectly.
Across 2,879 successful runs on ChatGPT’s primary surface, Foursquare-controlled domains appeared in:
- 0.00% of visible citations
- 0.00% of retrieved-but-not-shown sources
- 0.00% of structured business-card links
The result was zero across all 12 verticals and all three market tiers, including food, nightlife, and dense urban markets.
A separate collection used 1,728 prompts on a different API surface. It produced one Foursquare citation: a place-redirect page for a gym in Los Angeles.
That is 0.06%, with a 95% confidence interval of 0.01–0.33%.
| Grounding layer | Runs | Share | 95% CI |
|---|---|---|---|
| Visible citation, primary surface | 2,879 | 0.00% | 0.00–0.13% |
| Retrieved but not cited, primary surface | 2,879 | 0.00% | 0.00–0.13% |
| Business-card grounding, primary surface | 2,879 | 0.00% | 0.00–0.13% |
| Visible citation, independent cross-check | 1,728 | 0.06% | 0.01–0.33% |
One citation is not zero. It is an extremely small observed rate, and it is plainly incompatible with a 60–70% citation share in this sample.
This does not show that the original Spanish result was false when it was measured. It shows that the broad 60–70% claim does not describe this large, current US sample.
Finding 2: Yelp occupied the structured-card slot
A non-exclusive Yelp data-licensing agreement was reported on July 23, 2026, four weeks before this collection.
Yelp appeared in the structured grounding attached to ChatGPT’s business cards on 95.83% of runs.
| Provider | Visibly cited | Retrieved | Business-card grounding |
|---|---|---|---|
| Yelp | 1.04% | 2.08% | 95.83% |
| TripAdvisor | 13.55% | 20.70% | 28.90% |
| OpenTable | 1.70% | 3.58% | 16.88% |
| Resy | 0.00% | 0.00% | 8.96% |
| 0.07% | 0.17% | 4.62% | |
| Apple Maps | 0.14% | 0.97% | 0.00% |
| Foursquare | 0.00% | 0.00% | 0.00% |
Provider shares can overlap because a run may contain more than one provider.
Yelp’s business-card grounding ranged from 93.75% for hair salons to 97.92% for plumbers. It was not confined to Yelp-friendly categories.
Foursquare was the only one of the ten tracked local-data providers—including smaller names such as Bing—that measured zero across every layer on the primary surface.
The supported interpretation is a partnership snapshot. It should not be treated as a permanent property of Yelp, Foursquare, or ChatGPT.
Finding 3: The hidden-influence explanation was not supported
A near-zero citation rate does not prove that Foursquare data is absent from the answer. Structured data could influence ChatGPT without appearing as a link.
We tested that indirectly by comparing the businesses ChatGPT named with ranked business sets from Google and Foursquare for the same market and category. If Foursquare were the stronger hidden grounding source, ChatGPT’s set should resemble Foursquare’s more.
Across 137 comparable market-and-category combinations:
- Mean overlap with Google: 7.5%
- Mean overlap with Foursquare: 5.7%
- Paired difference: Wilcoxon signed-rank p = 0.008
ChatGPT’s named businesses resembled Google’s set more. The result ran opposite to what the Foursquare-grounding explanation predicted.
This does not rule out every possible form of hidden Foursquare influence. Jaccard overlap is one proxy, business-name matching is automated, and recall was not measured. It is the strongest proxy test specified in advance, not direct observation of ChatGPT’s internal grounding process.
The more durable finding: caveats disappear
The original researcher measured 60–70% for first-ranked results in five Spanish cities in May 2025.
Nine days later, the number was already being repeated as a general statement about ChatGPT local results. Geography, ranking scope, date, and sample size had disappeared.
Later versions grew more confident. Some rounded the figure upward. One introduced a comparison with Google and Yelp that did not exist in the original research. Another presented the number without a source.
The pattern is not that the original study was fabricated. It is that a memorable number travelled farther than its scope.
Four habits that would have stopped the chain
- Find the primary source before repeating the number.
- Carry the scope with the figure: five Spanish cities, first result, May 2025.
- Treat citing and hedging as separate responsibilities.
- Recheck partnership-dependent claims because the underlying integrations can change.
What local businesses should do with this
- This dataset does not support prioritizing Foursquare listing work as a current US ChatGPT-visibility tactic.
- Yelp occupied the structured business-card grounding slot across nearly every tested run and category during this collection window.
- No Foursquare-friendly category or dense-city pocket appeared in the primary-surface results.
- Recheck the data before acting later. This is a single August 2026 snapshot, four weeks after a competing licensing announcement.
Predictions, scored
| Prediction | Confidence | Result |
|---|---|---|
| Foursquare share below 6% | 70% | Confirmed; observed range was 0.00–0.06% |
| Highest in food/nightlife and near zero in home services | 80% | Inconclusive; every vertical was at the floor on the primary surface |
| Higher in dense urban markets | 65% | Inconclusive; every market tier was at the same floor |
| “Foursquare” named in response text below 2% | 75% | Confirmed; observed rate was 0.00% |
| ChatGPT’s picks would not resemble Foursquare more than Google | 55% | Confirmed; Google resemblance was significantly higher |
The predicted category and market gradients could not be evaluated because Foursquare’s presence was uniformly zero. A floor is a stronger null result, but it is not the gradient that was predicted.
Methodology
Collection
The main sample used 2,880 prompts from a 12-vertical × 12-metro × template design. It was weighted toward categories and cities where Foursquare should be strongest, with plumbers and auto repair retained as unfavorable controls.
ChatGPT’s primary surface returned usable data for 2,879 prompts. A separate set of 1,728 prompts was collected independently on another API surface. Together they produced 4,607 successful runs.
All collection occurred within one 72-hour period in August 2026.
Grounding layers
We measured three layers separately:
- Domains cited in visible links
- Domains retrieved without being displayed
- URLs attached to structured business cards
Ten local-data providers were tracked across all three. Provider ownership was assigned with explicit domain buckets rather than substring matching, allowing subdomains and redirect hosts to resolve to the correct provider.
Resemblance test
For the same market and category, we compared the businesses ChatGPT named with ranked sets from Google and Foursquare using Jaccard overlap.
There were 137 combinations with usable sets from all three sources. Significance was tested with a Wilcoxon signed-rank test on paired differences, with a bootstrap confidence interval for the mean difference.
Provenance trace
The trace contains ten nodes found through systematic search. Each was dated, archived, and recorded with its wording, number, cited upstream sources, and whether any caveat remained.
The 87.5% caveat-loss figure refers to eight downstream repetitions, seven of which used no hedge.
Limitations
- Citation share is not data influence. Zero visible or retrieved citations do not prove that Foursquare data never affects ChatGPT. The resemblance test is an indirect proxy based on one similarity measure.
- This is one snapshot. Collection covered one 72-hour period in August 2026, four weeks after a competing licensing agreement was announced. Earlier or later runs may differ.
- US, English, and ChatGPT only. The results do not transfer to other assistants, countries, or languages. The original result may still describe Spain.
- The provenance trace is not exhaustive. It covers ten nodes found through systematic search. The 87.5% figure has a denominator of eight downstream repetitions.
- Third-party collection. These are generic, non-personalized results, not the experience of a signed-in user with individual history and location.
- Automated entity matching. The ChatGPT, Google, and Foursquare business-name matching was heuristic. A validation sample showed clean precision, but recall was not measured.
See the stats/study in context: Steady Demand Research Index
